Environmental Performance in Operations - 2018 Harman Sustainability Report
Header banner

Environmental Performance in Operations

As we continue to strive to enhance life’s experiences with technological advancements and industry firsts, we are driven to always consider the responsible use of energy and water and to minimize waste.

Environmental Footprint

Our mission to create both stakeholder and societal value includes a deliberate focus on reducing our company’s environmental footprint, collaborating with others toward sustainable business solutions, and pioneering new technologies that advance sustainability.

  • On an operational level, HARMAN's data management system allows us to effectively report environmental metrics from our operations, including energy use and utility cost information, so that we can identify strategic approaches to facility optimization. By understanding facility-level metrics, we can improve efficiency of operating units and processes by optimizing resources according to our baseline understanding of energy use.
  • Our customers' drive towards lower carbon products has influenced our strategy to better align with their needs and expectations.
Energy Efficiency and Site Optimization

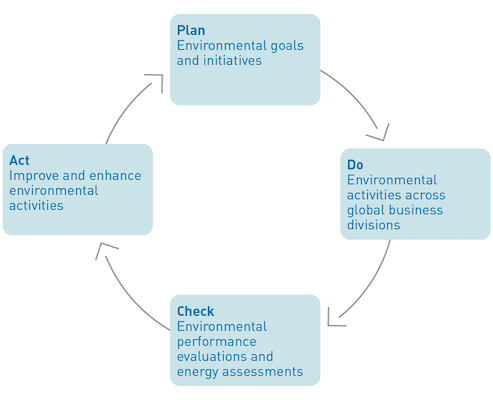
Our worldwide energy reduction management system, which uses a traditional Plan-Do-Check-Act cycle along with elements of ISO 50001, strengthens our approach to energy management. Teams around the globe are responsible for identifying goals and targets, setting key performance indicators (KPIs) and executing projects to drive continuous improvement. Under this program, energy usage is tracked on a monthly basis across several HARMAN production facilities.

Energy Efficiency graphic

Energy Efficiency graphic

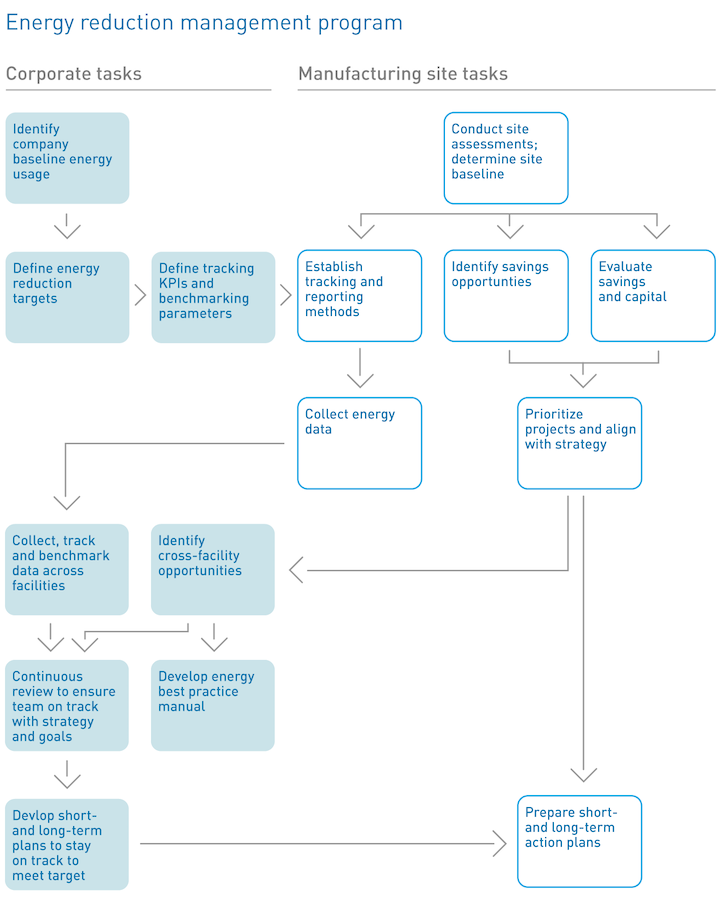
In 2017, HARMAN began working closely with global operations to better understand opportunities to implement energy saving initiatives at global locations. We set out to uncover opportunities such as energy consumption reduction, equipment/capital upgrades, and improved global methodology.

To develop a more comprehensive baseline understanding of our manufacturing footprint, we asked 13 sites to complete a customized Site Assessment tool to collect information on site characteristics, including topics such as regulatory requirement, building envelope, equipment and operations, and energy use.

Total Improvement Potential ratings

Our sites also provided information about any ongoing or planned improvement projects, to help us build a detailed understanding of each location’s maturity level. Using a pre-defined scoring methodology, we identified the Total Improvement Potential for each location in the following categories: lighting upgrades; compressed air optimization; steam system improvements; chillers; HVAC upgrades; building management systems; process improvements; idle equipment; and employee engagement.

Through data analysis and site-level communication, we are producing baseline performance evaluations and site-specific targets at the plant level, which will support scenario planning and implementation of improvement opportunities. By better tracking and understanding where energy is used, we hope to put in place long-lasting actions to help reduce our manufacturing carbon footprint and expand reporting on energy use at our global locations.

Eco-Design
Energy Efficiency graphic

Eco-design is a principle that calls for minimizing the negative environmental and human health impacts of a product across its life-cycle.

In 2017, we completed our first Eco-Design workshop and training session for a group of engineers in Novi, Michigan. The primary objectives of the training were to:

  1. Educate our engineering team on Eco-Design elements beyond regulations
  2. Evaluate environmental and business benefits and value from incorporating Eco-design materials into product design

Additionally, we completed two life-cycle assessments for a subwoofer and an amplifier to understand the relative environmental impacts of recently designed products. The life-cycle assessments were conducted by a third-party expert, and carbon dioxide-equivalent emissions for each of the life-cycle stages were shared, comparing products and suggesting Eco-Design improvements for each.

The key takeaways from the workshop were:

  • Using scorecards, we can quantify and implement quality and cost-savings into product development and embed sustainability in products
  • The Eco-Design scorecard can also be used to measure future progress on the incorporation of sustainable design into our products
  • By using a systems approach to combine speakers and amplifiers, we reduce power consumption to reduce weight and carbon dioxide emissions

As part of our continuous improvement and learning mindset, we commit to regularly conducting new and relevant Eco-Design workshops and training sessions to ensure we provide our employees with the tools they need so they can then develop strategies that benefit others.

Energy and Greenhouse Gas Emissions

We first started publicly reporting our greenhouse gas emissions in our 2011 Sustainability Report and have since evolved our emissions reduction strategy to focus on operational efficiency. Our company-owned operations generate greenhouse gas emissions primarily through the combustion of fuels on-site (Scope 1) and through the purchase and usage of grid electricity (Scope 2). The emissions generated from electricity purchases are the dominant contributor to total emissions.

Following the March 2017 Samsung acquisition, HARMAN’s fiscal schedule changed to a Calendar Year to match Samsung’s reporting cycle. For this report, we took a focused approach to data collection and refined the scope of facilities included in emissions calculations based on opportunities related to energy management. Over the next two years, we plan to continuously evaluate the scope to ensure the most relevant facilities are included in our data tracking and reporting. In 2017, we reported the following emissions (in carbon dioxide equivalent (CO2e).

  • Scope 1 emissions (metric tons CO2e) - CY2017: 5,660
  • Scope 2 emissions (metrics tons CO2e) - CY2017: 47,643

Our first energy reduction goal was to achieve 10 percent energy reduction by FY2017 at every HARMAN site worldwide. We achieved this goal in 2016 and plan to re-evaluate our baseline and to establish a new goal that aligns with our Calendar Year reporting schedule and operational management system projections moving forward.

Due primarily to our global footprint and internal infrastructure, we view both Scope 1 and Scope 2 emissions as within the boundary of our operational control. Outside of our operations control, we continue tracking our Scope 3 emissions from commercial air and rail travel and will continue to engage with our value chain on their environmental footprint. Improved accuracy of our data collection methodology and alignment with Samsung’s fiscal year led us to redefine the scope of facilities to be included in emissions data calculations for 2017.

Over the past two years, we have achieved savings of over 3,300 metric tonnes CO2e by implementing move than 30 energy savings projects at our global locations to reduce our overall carbon footprint. Several of these include, but are not limited to:

  1. At one of our locations in Bangalore, India, we moved 80 percent of our electricity sourcing to a solar supplier, while the remaining 20 percent comes from the government provider. By doing so, we are expected to reduce our annual electricity spend by approximately 20 percent at this facility. We also relocated an external warehouse, which led to approximately 0.43 metric tonnes CO2e saved by way of fuel avoidance.
  2. In our Dandong location, we installed a frequency inverter in central A/C system fans in our workshop. The frequency of the fan power changes with the seasonal changes. We also installed a timer in the canteen and installed motion-activated sensor lights to control lamp switches when someone is active in corridor.
  3. At our Suzhou location, we improved air handling and makeup air unit’s variable speed drive control. For one lab, the actual heat loading is less than design heat loading and since the equipment is not fully occupied at all times, and we added an air handling unit/makeup air unit motor variable speed drive control for energy saving. This saved an estimated 117.54 metric tonnes CO2e and over $20,000 USD in energy costs.
  4. In our Szekesfehervar location, we implemented an adiabatic system and changed the outside chillers on certain buildings. Adiabatic heat exchangers and condensers have a pipe construction that runs underneath or to the side of the heat exchanger with integral spray jets, allowing the intake temperature to be reduced by adiabatic means where external temperatures are high. Water in aerosol form is sprayed into the intake air from the spray jets, with evaporative cooling achieving a marked cooling effect.

    The benefits from these investments include:
    • Reduced the electric consumption in cooling periods
    • Reduction in the chillers’ workload
    • More cooling capacity from built-in units
    • Safer operations during high summer temperatures
Water and Waste Management

HARMAN fully recognizes the importance of good water stewardship to meet the needs of communities and our ecosystem, though our production processes themselves are not water intensive. Aspects of water stewardship (e.g., water use, wastewater management) were not identified as “material” in our 2016 Materiality Assessment refresh, but we recognize the importance of water stewardship. We will continue to monitor and measure the water used in our processes, to identify opportunities for water conservation in our operations and throughout our value chain, and to gain a comprehensive understanding of HARMAN’s environmental impacts.

Similar to our energy management approach, HARMAN uses a traditional Plan-Do-Check-Act cycle to monitor water management at its production facilities and is committed to the principles of continual improvement in water use efficiency.

Waste reduction and recycling is also a priority at HARMAN, and we are committed to the principles of continual improvement in reducing the amount of waste generated.

Capturing the amount of waste generated at our facilities helps us identify opportunities for improvement, such as recycling, landfill diversion, and reduction. Although waste was not identified as “material” based on feedback from internal and external stakeholders as part of our 2016 Materiality Assessment refresh, we will continue to collect waste data from our manufacturing, research & development and non-manufacturing facilities. As with energy and water management, HARMAN uses a traditional Plan-Do-Check-Act cycle to approach waste management at our production facilities.